26th issue of the Financial Stability Report (FSR) - December 2022
Reserve Bank released the 26th issue of the Financial Stability Report (FSR), which reflects the collective assessment of the Sub-Committee of the Financial Stability and Development Council (FSDC) on risks to financial stability and the resilience of the financial system.
Highlights Financial Stability Report (FSR) by RBI:
Global Economy
Since the June 2022 issue of the Financial Stability Report (FSR), the global economic outlook has deteriorated further. Risks to financial stability have become accentuated as central banks have aggressively front-loaded monetary policy tightening synchronously across countries and have given hawkish forward guidance. International organizations, including the International Monetary Fund (IMF), the World Bank (WB) and the Organization for Economic Co-operation and Development (OECD) have downgraded their global growth projections relative to their previous revisions
Updates in Above official Diagram:-
- Recently in November, 2022 forecast by the OECD estimates that the international economy would expand only 2.2% in 2023. Earlier in June, it was estimated to be around 2.8%.
- The IMF projections show that global growth will slow down to 2.7 per cent in 2023 from 3.2 per cent in 2022 and 6 per cent in 2021.
The global economy is facing formidable headwinds with recessionary risks looming large. The interplay of multiple shocks has resulted in tightened financial conditions and heightened volatility in financial markets.
The aggressive tightening of monetary policy is likely to continue over the next one year. The current tightening phase has two characteristics that stand out historically. First, it is the most synchronized in the previous 50 years. Second, policy rate increases are happening twice as quickly as they did previously.
- The front-loaded and faster-than-usual pace of tightening has consequences for financial stability as it is interacting with financial system vulnerabilities through multiple channels.
What does it mean to tighten monetary policy or financial condition?
Tightening of monetary policy is implemented when the inflation is rising rapidly. When monetary policy is tightened, the interest rates are increased by the central bank and money supply is reduced. In this policy, the reserve requirements of banks are raised and government securities are sold. Throughout the world, most of the central banks are raising rates to fight inflation and it is also mainly driven by US Federal reserve.
What does it mean of heightened volatility in financial markets?
- If the price fluctuates rapidly in a short period, hitting new highs and lows, it is said to have high volatility. If the price moves higher or lower more slowly, or stays relatively stable, it is said to have low volatility.
- Indian share market has been declining since mid-October, largely led by Foreign Portfolio Investors (FPIs) withdrawing funds from Indian equities.
- The major factors driving FPI selling during the last 2 to 3 months have been the steady appreciation of the dollar and rising interest rates in US
- Back in December 2021, US Federal Reserve announced that it will stop infusing fresh covid induced stimulus in to the US economy from March, 2022 and the Fed’s projections indicated 3 to 4 rate hikes of 25 basis points in 2022, which is expected to raise further in 2023. This is negative for stocks since the higher yields will make money flow into bond markets.
- Also, the extremely low rates of interest of G7 nations caused risky assets such as stocks, cryptocurrencies, SPACs etc to race higher. This was possible because traders could borrow at extremely low rates of interest and invest in these assets.
- As rates move higher, these loans will be deleveraged and the assets bought with the funds need to be sold to repay the loans. The tendency is to typically sell assets which are overvalued.
- The scars from these shocks are likely to be long lasting, with persistent output losses and reduced economic potential
Other Global Macro financial Risks
- According to the IMF, global debt after witnessing the largest one-year increase of 29 percentage points of GDP in 2020, fell 10 percentage points of GDP in 20211. Global debt to GDP ratio, however, remained 19 percentage points above pre-pandemic levels.
- In USD terms, global debt has risen steadily and now stands at a record-high of US $235 trillion. As central banks raise interest rates to combat inflation, raising borrowing costs for both the public and private sectors, high debt vulnerabilities need to be managed.
- Debt distress is particularly worrisome in low-income emerging nations where pandemic scars are more pronounced and sovereign spreads are sharply rising.
- The cost-of-living crisis in several countries has brought the focus of attention on the limited fiscal policy space available to prevent or mitigate resulting welfare losses in view of elevated debt levels and rapidly rising borrowing costs.
- According to the IMF, global government debt is projected at 91 per cent of GDP in 2022, 7.5 per cent above the pre-pandemic level.
- Going forward, fiscal deficits are projected to reach 3.6 per cent of GDP in AEs and 6.2 per cent in emerging market economies (EMEs)
Currency Volatility
- Large exchange rate fluctuations have been triggered by global shocks and spillovers, and monetary policy actions to keep inflation under control. The USD, in particular, has strengthened sharply against currencies of both advanced and emerging market economies
- Changes in terms of trade have been a major driver of recent exchange rate movements. Countries that have experienced worsening terms of trade, especially those that are heavily dependent on energy imports, have also seen larger depreciations of their currencies than commodity exporters
- The divergent pace of monetary policy tightening across nations has been another important driver influencing currency movements. Larger depreciations against the USD have typically been correlated with policy rate differentials vis-à-vis the US
- The 2022 Bank for International Settlements (BIS) Triennial Survey of Foreign Exchange and Over-the-counter (OTC) Derivatives Markets shows continued dominance of the USD in global currency trade, with the USD on one side of 88 per cent of all trades.
- An increase in the value of the USD also tends to increase inflation by driving up import prices particularly of commodities which are invoiced in the USD. In fact, in a departure from past episodes, elevated commodity prices have coincided with USD appreciation
- From EMEs’ perspective, a stronger USD has led to capital outflows and increased debt servicing costs on dollar-denominated debt. Historically, economic downturns in EMEs are associated with USD appreciation shocks in view of less developed and shallow financial markets and weak balance sheets
- A stress test conducted by the IMF for banks in 29 economies - 24 AEs and 5 EMEs, including India – with combined banking sector assets accounting for 70 per cent of global banking assets suggests that, at the aggregate level, the global banking sector generally remains resilient to pandemic shocks. Their common equity tier 1 (CET1) capital ratios will decline by 2.5 percentage points for AE banks and 5.5 percentage points for EME banks under a severe downturn scenario.
- Climate risks are rising across the globe as drought, flooding, summer heat waves and harsh winters are increasing in severity and becoming more frequent in both southern and northern hemisphere. Economies are coordinating and working towards an ambitious plan that accelerates both mitigation and adaptation efforts to combat the threat of climate change. A key plank of these efforts is to scale up climate financing in coming years for mitigation finance, i.e., reducing greenhouse gas emissions, and adaptation finance, which is needed to adapt to adverse effects of climate change. Since two-thirds of worldwide greenhouse gas emissions come from EMDEs, and many of them are extremely vulnerable to climate risks, their need for climate financing is substantial.
- According to the International Energy Agency (IEA), EMDEs must expand their investments in clean energy to US $1 trillion annually by 2030, if they are to remain on course to reach net-zero greenhouse gas emissions by 2050
- Furthermore, their estimated annual adaptation financing need ranges from US $160 billion to US $340 billion by 2030 and US $315 billion to US $565 billion by 2050, with adaptation finance gap in these economies five to ten times more than existing global adaptation finance flows
- In the face of significant climate finance needs, underinvestment could increase financial stability risks by increasing exposure to climate-related financial risks
- With public finance at stretched levels in the wake of the pandemic, private finance is key to meeting climate financing needs in EMDEs. Scaling up private climate finance, however, faces many challenges. Lack of depth in domestic capital markets, low returns, information asymmetry about investment benefits in the absence of data and disclosures, and higher credit risk are some of the main reasons deterring investor interest. Though environmental, social, and governance (ESG) investment is growing, low ESG scores of firms in EMDEs compared to their counterparts in AEs are hampering allocation of institutional funds to EMDE assets.
- The collapse and bankruptcy of the crypto exchange FTX and subsequent sell-off in crypto assets market have highlighted the inherent vulnerabilities in the crypto ecosystem.
- Recently, Binance, the largest crypto exchange has also prohibited withdrawals of stablecoins on its platform. The implosion of FTX was preceded by failure of TerraUSD/Luna, an algorithmic stablecoin, a run on Celsius, a crypto lender, and bankruptcy of Three Arrows Capital, a cryptocurrency hedge fund.
- The turmoil has provided several insights. First, crypto assets are highly volatile. The price of Bitcoin has decreased by 74 per cent (as on December 14, 2022) from its peak in November 2021. Other crypto assets have also experienced similar falls in prices and heightened volatility
- Second, the collapse of TerraUSD/Luna is a reminder of how so-called stablecoins that promise to maintain a stable value relative to fiat currency are subject to classic confidence runs. Finally, failure of FTX and Celsius reveals that crypto exchanges and trading platforms were carrying out different functions such as lending, brokerage, clearing and settlement that have different risks without appropriate governance structures. This exposed them to credit, market and liquidity risks disproportionate to what was necessary to discharge their essential functions
- Improved supply conditions and slowing global demand since the release of the last FSR in June 2022 has brought down global prices of non-energy commodities below their pre-Russia-Ukraine war levels and energy prices have also moderated after August 2022. Concomitantly, there has been a fall in freight rates and easing of supply-side bottlenecks
- In many economies, however, currency depreciations have kept commodity prices in local-currency term at still elevated levels and much above their averages over the last five years
- For poorer economies, this is a double blow as commodity-driven inflation is likely to precipitate a humanitarian crisis.
- After expected increases of 60 per cent in 2022, energy prices are projected to fall in 2023 and 2024 driven by slower global growth, weaker demand for natural gas and climate transition.
- Nevertheless, they are expected to remain volatile in view of geopolitical stresses and lower strategic reserves in many countries, with second-order effects such as increased electricity and transportation expenses.
- The food price index of the Food and Agriculture Organization (FAO) recorded a sequential (m-o-m) decline for the eighth successive month in November 2022.
- It is projected to fall further in 2023, supported by a higher-than-anticipated global wheat harvest, stable rice market supply, and the restart of grain exports from Ukraine.
- Accelerated digitalization, supported by technological innovation, and spread of private-sector digital ventures, have led to the proliferation of initiatives to launch central bank digital currencies (CBDCs)
- The experiments from front-runners to subsequent movers are offering valuable lessons about challenges to the introduction of CBDC.
- CBDCs have financial stability and monetary policy implications. There is still animated debate around potential impact of a CBDC on banking (dis) intermediation.
- Four key factors are important
- First, depending upon market power of banks in deposit markets, the entry of a CBDC that directly competes with bank deposits may result in higher deposit rates.
- Second, the effect of CBDC on bank disintermediation will depend on the interest rate offered on CBDCs, which, if high enough, can cause bank disintermediation. The market power of banks will determine the direction of intermediation when rates are in an intermediate range.
- Third, a CBDC would have negligible effect on intermediation if banks can replace any lost retail deposits with wholesale funding, which is especially important for larger banks.
- Finally, the degree of bank disintermediation may be limited by restrictions placed on the amount of CBDC that users may hold, transact, or earn interest on.
- There are a few lessons emerging from CBDC experiments so far
- First, in introducing a CBDC, it is necessary to balance trade-offs between several objectives while choosing the appropriate technology. These trade-offs consist of design choices including centralized versus decentralized ledger systems; choice between privacy and compliance; and stability and innovation.
- Second, developing a successful CBDC is more challenging than initially thought of, as two opposing forces are at play: being “too successful” and driving away private payment options or “being not successful enough” and failing to generate enough demand.
- Finally, private-public collaborations for CBDCs may be essential as it will help in putting in place appropriate governance for the division of labour, costs, and authority.
Domestic Economy
The Indian economy is confronting strong global headwinds. Yet, sound macroeconomic fundamentals and healthy financial and non-financial sector balance sheets are providing strength and resilience and engendering financial system stability.
Buoyant demand for bank credit and early signs of a revival in investment cycle are benefiting from improved asset quality, return to profitability and strong capital and liquidity buffers of scheduled commercial banks (SCBs).
| Table: Growth in Wholesale Credit | ||||||||
| (y-o-y; per cent) | ||||||||
| PSU | Non-PSU | |||||||
| Mar-21 | Sep-21 | Mar-22 | Sep-22 | Mar-21 | Sep-21 | Mar-22 | Sep-22 | |
| PSB | 5.4 | 11.9 | 15.1 | 22.6 | -9.0 | -9.1 | 0.0 | 9.7 |
| PVB | 60.0 | 20.1 | 9.0 | 20.2 | -6.1 | -1.2 | 13.5 | 20.6 |
| PSB+PVB | 11.7 | 13.1 | 14.1 | 22.2 | -7.7 | -6.0 | 5.4 | 14.2 |
| Source: RBI supervisory returns and staff calculations. | ||||||||
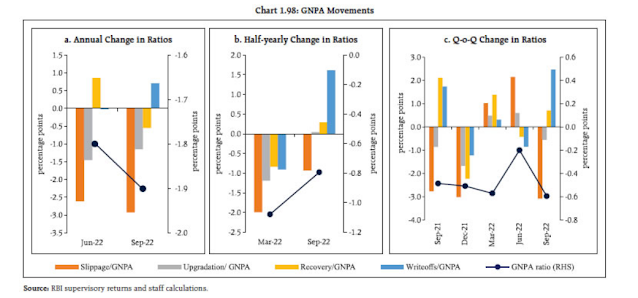
The gross non-performing asset (GNPA) ratio of scheduled commercial banks (SCBs) fell to a seven-year low of 5.0 per cent and net non-performing assets (NNPA) have dropped to ten-year low of 1.3 per cent in September 2022.
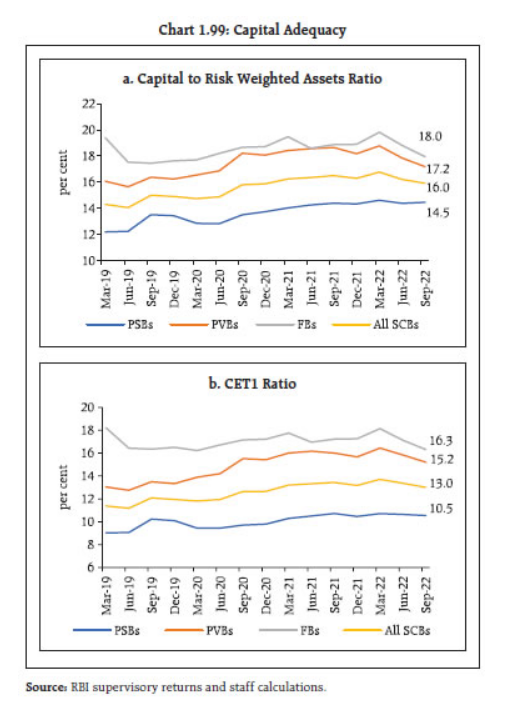
Macro stress tests for credit risk reveal that SCBs would be able to comply with the minimum capital requirements even under severe stress scenarios. The system-level capital to risk weighted assets ratio (CRAR) in September 2023, under baseline, medium and severe stress scenarios, is projected at 14.9 per cent, 14.0 per cent and 13.1 per cent, respectively.
Money Markets, Government Securities and Corporate Bond Markets
- Domestic financial conditions have tightened in response to the focus of the monetary policy stance on withdrawal of accommodation to ensure that inflation remains within the target going forward, while supporting growth. Money market rates and short-term bond yields have hardened in tandem with policy rate increases.
- The average daily absorption under the liquidity adjustment facility (LAF) has declined from ₹7.8 lakh crore in April 2022 to ₹3.8 lakh crore in June-July 2022 and further to ₹1.4 lakh crore in November 2022.
- NBFCs sector has recovered strongly in the wake of the second wave of COVID-19, with asset quality showing a continuous improvement. The GNPA ratio of the sector (excluding core investment companies) fell from 6.9 per cent in June 2021 to 5.1 per cent in September 2022. Special mention accounts (SMAs), however, increased from 8.5 per cent of total advances in December 2021 to 10.8 per cent in September 2022. Pockets of stress are observed in select NBFC cohorts, viz., NBFC-Investment and Credit Companies (GNPA ratio of 6.9 per cent) and NBFC-Factor (GNPA ratio of 6.8 per cent)
- The revised clarification with respect to asset classification, which came into effect from October 1, 2022, mandates that all NBFCs are required to collect the entire arrears to upgrade an NPA. Asset classification would start exactly from the overdue date, unlike the present practice of starting 90 days from the end of the month in which the account becomes overdue. These regulatory refinements could impact the sector’s assessment of asset quality in the near term.
- The overall GNPA ratio (PSBs and PVBs) in the MSME sector fell from 9.3 per cent in March 2022 to 7.7 per cent in September 2022. Asset quality of advances below ₹25 crore, which are usually vulnerable to asset quality concerns, improved in September 2022 vis-à-vis March 2022. Regulatory forbearance and restructuring schemes introduced since 2018 came to an end. As on September 30, 2022, the share of restructured loans in the MSME portfolio of SCBs stood at 5.21 per cent compared to 5.31 per cent as on March 31, 2022
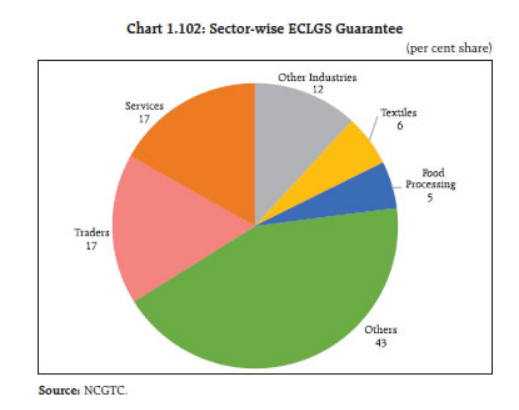
- The ECLGS was pivotal in providing support and additional liquidity for business entities to tide over COVID-19. Under the ECLGS, an amount of ₹2.82 lakh crore has been disbursed till September 30, 2022, of which SCBs have disbursed ₹2.46 lakh crore, with predominant share of disbursals under the ECLGS 1.0
- The major sectors availing the ECLGS were services and traders, which were among the most impacted by the pandemic.
- Disaggregated analysis of borrowers availing the ECLGS indicates that majority of the smaller borrowers belonged to the micro enterprises category.
- The September 2022 position of the ECLGS lending indicates that distress continues in the MSME sector, with one-sixth of accounts that availed funds under the ECLGS turning NPA
- Even though the micro enterprises segment availed a quarter of loans disbursed under the ECLGS, their share in overall NPAs stood much higher.
External Sector Developments and Foreign Exchange Markets
- India’s external sector is facing strong global headwinds from rising risks of global slowdown, still elevated commodity prices and volatility in capital flows. While the moderation in external demand has pulled merchandise exports into contraction in October 2022, the terms of trade shock has kept imports on a rising scale.
- This resulted in a widening of the merchandise trade deficit to US $198.3 billion during April-November 2022 as compared with US $115.4 billion in the corresponding period last year. Despite some reversal in commodity prices alongside a fall in global freight rates from historic highs, the worsening outlook for exports may continue to exercise pressure on trade and current account balance
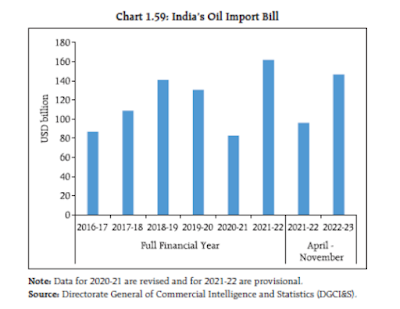
- The rising oil import bill which reflects a structural dependence on imported energy has limited the scope of policy manoeuvrability
- India’s share in global crude oil consumption has increased from 3.0 per cent in 2000 to 3.8 per cent in 2010 and further to 5.2 per cent in 2021
- In fact, of the increase in global petroleum demand by 2 million barrels per day in 2022, one-fifth is accounted for by India. India is a price taker in respect of crude oil, and the recent depreciation of the Indian Rupee (INR) against the USD – the currency of denomination of international crude oil prices – has amplified the pressure on imports.
- India’s CAD widened to 4.4 per cent of GDP in Q2:2022-23 from 2.2 per cent of GDP in the previous quarter and 1.2 per cent in 2021-22. The rise in CAD was primarily on account of the widening of merchandise trade deficit reflecting the impact of slowing global demand on exports, even as growth in services exports and remittances remained robust.
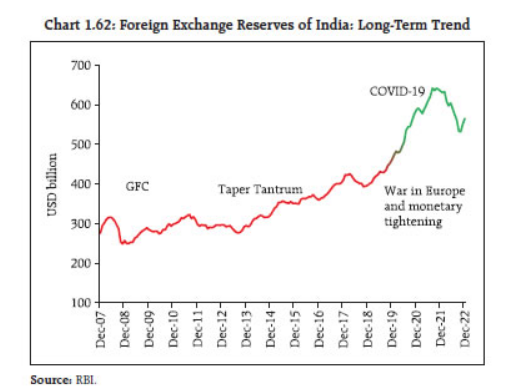
- Net capital flows led by foreign portfolio investment (FPI) (US $6.5 billion), foreign direct investment (FDI) (US $6.4 billion) and trade credit (US $5.1 billion) fell short of the funding requirements of CAD, resulting in a depletion of foreign exchange reserves to the tune of US $30.4 billion on a balance of payments (BoP) basis during Q2:2022-23
- During Q3:2022-23 (up to December 16, 2022), foreign exchange reserves increased by US $30.8 billion from US $532.7 billion as on September 30, 2022.
- During 2022-23 so far, net FDI at US $22.7 billion remains above its level a year ago. FPI inflows amounted to US $11.6 billion in July-December (till December 14, 2022) and narrowed the net outflows for the financial year so far to US $2.7 billion due to heavy outflows during April-June 2022
- Net inflows from external commercial borrowings (ECBs) turned negative on account of repayments while non-resident deposits picked up from their levels a year ago.
- India’s foreign exchange reserves amounted to US $563.5 billion as on December 16, 2022, providing strong buffers against global spillovers
- Of the decline in reserves by US $75 billion in 2022-23 (as on end-September, 2022), about 66.0 per cent can be attributed to valuation losses as the USD strengthened and yields on treasuries and other sovereign bonds rose
- India’s external debt stood at US $610.5 billion at end-September 2022, with short-term debt (on residual maturity basis) constituting 45.0 per cent. Over time, the share of dollar-denominated debt has been falling, while that of rupee-denominated debt has gone up
Mutual Funds
- AUM of the domestic mutual fund industry, excluding domestic fund of funds (FoF), went up by 13.3 per cent between June-November 2022 to a high of ₹40.4 trillion. The AUM of cities that are beyond the top 30, i.e., B30 cities also witnessed a rise of 19 per cent during the same period, led by increased awareness about mutual funds and ease of transactions through digitization.
- There was a 21.1 per cent rise in the AUM of equity-oriented schemes across all categories. Exchange traded funds and index funds also witnessed sizable net inflows. Open-ended debt-oriented schemes barring liquid funds, gilt funds and long duration funds witnessed net outflows
Alternative Investment Funds
- Funds mobilization by alternative investment funds (AIFs) has increased consistently over the years in terms of both commitments raised and investments made. The cumulative investments made by Category-I, Category-II and Category-III AIFs
- AIFs offer relatively higher return to their investors through investments in assets that are less correlated with traditional investments like traded stocks and bonds. They deploy bulk of their funds in unlisted equities and debt instruments, including securitised products
- The AIF ecosystem has been consolidating in the country on the back of increasing investor interest and simultaneous development of a robust regulatory framework. Their activities need close monitoring across venture capital funds, SME funds, real estate funds, private equity funds, funds for distressed assets and hedge funds. Their remuneration policies, extent of financial leverage and risk management practices can potentially pose systemic risks.
- In this context, the SEBI has recently amended the SEBI (AIF) Regulations, 2012, to ensure that the assets and liabilities of each scheme are segregated and ringfenced from those of other schemes. Furthermore, bank accounts and securities accounts of each scheme are also segregated and ringfenced from those of other schemes.
FSR Report by RBI
Financial Stability Reports Financial Stability Reports are published by Reserve Bank of India by taking inputs from financial sector regulators i.e., RBI, SEBI, PFRDA, IRDAI including Ministry of Finance RBI can publish this report only after being approved by Financial Stability and Development Council (FSDC) Sub-Committee.
- It is published bi-annually (once in every six months).
- The FSRs are periodic exercise for reviewing the nature, magnitude and implications of risks that may have a bearing on the macroeconomic environment, financial institutions, markets and infrastructure.
- These reports also assess the resilience of the financial sector through stress tests.
- Stress tests are used to gauge how certain unfavorable economic scenarios, such as a deep recession or financial crisis will affect a company, industry or specific portfolio.
- Stress tests are usually computer-generated simulation models that test hypothetical scenarios.
- FSR reflects the collective assessment of the Sub-Committee of the Financial Stability and Development Council (FSDC) on risks to financial stability and the resilience of the financial system.
- The FSDC Sub-committee has also been set up under the chairmanship of Governor, RBI.
- It meets more often than the full Council.
Financial Stability and Development Council (FSDC)
- FSDC, under the Chairmanship of the Union Finance Minister, is a non-statutory body which aims to strengthen and institutionalize the mechanism for maintaining financial stability and enhancing inter-regulatory coordination.
- The idea to create such a super regulatory body was first mooted by the Raghuram Rajan Committee in 2008.
- FSDC has replaced the High Level Coordination Committee on Financial Markets (HLCCFM), which was facilitating regulatory coordination, though informally, prior to the setting up of FSDC.
- Mandate
- Without prejudice to the autonomy of regulators, this Council would monitor macro prudential supervision of the economy, including the functioning of large financial conglomerates.
- It will address inter-regulatory coordination issues and thus spur financial sector development.
- It will also focus on financial literacy and financial inclusion.
- What distinguishes FSDC from other such similarly situated organizations across the globe is the additional mandate given for development of financial sector.






.png)